


Research paper
2 min
Good signs for global listed infrastructure in the coming year

Until recently, bond yields were in structural decline for several decades. During this time, investors saw valuations of almost all asset classes generally go in one direction – up. This also provided a very favourable outcome for levered investments. Private equity was a natural beneficiary of this environment due to the typically high debt levels used when financing their transactions. Unlisted infrastructure investments are one example of this, as anecdotally we observe that these assets utilise significantly higher leverage than equivalent publicly listed infrastructure assets.
In general, infrastructure assets have performed well over the past decade. For the 10 years to 31 December 2022, the listed infrastructure sector delivered 9.5% p.a. while the unlisted infrastructure sector delivered 11.4% p.a.* We are commonly asked to what extent these return differentials should be viewed as ongoing differences between the listed and unlisted markets versus those caused by temporary factors.
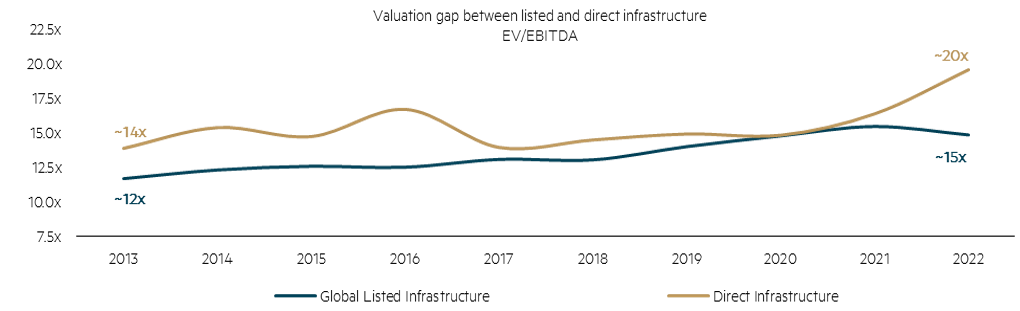
In the white paper, One Asset Class?, our colleague, Steven Kempler, compared infrastructure assets in the listed and unlisted markets. He concluded that ultimately the underlying assets are equivalent – they are based on the same regulatory and legal constructs, with no discernible difference in management expertise. One difference between the two markets is the materially higher debt levels used in unlisted assets. Another key difference, in our opinion, is the higher valuations being paid in the direct markets. In our view, the valuation gap between the two markets has continued to expand over the past decade to unprecedented levels.
In considering performance over the past 10 years, we believe these two factors were key reasons behind the higher returns seen by unlisted infrastructure. The higher leverage in the unlisted markets was positive during a period when asset values were rising. Additionally, the widening valuation gap between the listed and direct markets has driven an even stronger performance outcome for unlisted infrastructure.
Figure 1: Listed versus direct infrastructure valuations over the past decade
Source: Bloomberg, Infralogic, Sentieo, MBA GLI internal research, as at 31 December 2022. Notes: Global Listed Infrastructure is represented by the grossed-up weighted average EV/EBITDA of FTSE Global Core Infrastructure 50/50 Index constituents. Data uses broker consensus estimates and has been sourced from Bloomberg. It is substantially complete, although is missing a few data points due to either stocks not yet being listed or there being insufficient consensus estimates at any point in time. We have reviewed the data and are confident the results are not being distorted by any extreme individual data points. Unlisted Infrastructure is represented by the average EV/EBITDA of infrastructure transactions occurring within a given year. Analysis is based on approximately 240 infrastructure transactions occurring between 2013 and 2022. Past performance is not a reliable indicator of future performance.
It appears to us that the market does not fully appreciate the role these factors have played in the relative performance of listed versus unlisted infrastructure. Extrapolating further, we believe that of those who expect history to repeat itself, it is important to understand the implicit assumptions being made.
Even if valuations between the listed and unlisted market remain at the current wide range (and returns for investors are driven solely by current earnings and earnings growth as opposed to multiple expansion), then listed infrastructure should produce higher returns than unlisted infrastructure, simply due to the very different earnings yields currently available to investors. In other words, the higher prices currently paid in direct markets will likely lead to a significantly lower ongoing earnings yield over time.
For unlisted infrastructure to overcome this headwind and produce equivalent or better performance than listed – when investing in effectively the same assets – they will be dependent on one or both of:
If either of these assumptions begins to reverse, then we would expect unlisted infrastructure returns to face greater performance headwinds relative to listed.
In conclusion, while many investors espouse the benefits of earning an illiquidity premium through private market asset returns, we believe these assets, based on current market valuations, are likely to be earning a discounted return relative to their listed counterparts. Said differently, while unlisted infrastructure investors expect to earn an illiquidity premium, our view is that based on current purchase prices, it is likely they are receiving an illiquidity discount.
Investing in infrastructure can provide meaningful benefits to investors, enabling them to gain access to high quality assets that are often natural monopolies and exhibit low earnings and cash flow volatility through economic cycles. Many infrastructure assets also tend to provide income, inflation protection and portfolio diversification benefits. Additionally, the infrastructure sector is exposed to several strong, secular growth trends in the market, including decarbonisation and digitalisation, both of which offer significant and long-dated investment opportunities.
Due to these attractions, it is not surprising that investor demand for infrastructure assets has increased substantially across both listed and unlisted markets. Over the last 10 years to December 2022, assets under management (AUM) for global listed infrastructure (GLI) funds grew more than five-fold from approximately $27 billion to $155 billion.** There was similar growth on the unlisted infrastructure side, with assets under management growing from approximately $200 billion to over $1 trillion.**
In the white paper, One Asset Class?, we conducted detailed analysis comparing listed versus unlisted infrastructure assets, concluding that the underlying assets are essentially the same. Both are governed by the same regulators and operate under the same legal constructs. Additionally, evidence suggests management expertise, alignment and governance are often equal to, or in some cases, better in listed assets than unlisted equivalents.***
We compared some of the key characteristics of listed and unlisted infrastructure investments. In summary, investing in listed infrastructure typically offers investors with greater liquidity, access to a larger and more diverse universe of assets and exposure to companies with lower leverage and greater transparency/disclosure. On the other hand, investing in unlisted infrastructure typically offers investors with lower volatility, greater asset concentration, lower asset turnover and lower return correlations relative to other markets, including equities. In our opinion, the lower volatility and lower correlations are due to differences in valuation methodology and frequency.
Figure 2: Comparison of key characteristics
| Listed | Unlisted | |
| Investable universe | Larger | Smaller |
| Volatility | Perceived to be higher | Perceived to be lower (no mark-to-market) |
| Valuation frequency | Daily mark-to-market | Infrequent (typically quarterly or bi-annual) |
| Transparency/disclosure | Higher (due to exchange/regulatory requirements) | High for the manager, but lower for investors |
| Liquidity | Higher | Lower |
| Portfolio turnover | Higher | Lower |
| Asset prices | Lower in most sectors | Higher in most sectors |
| Cash flow | Historically predictable dividends | Regular cash payments |
| Control | Lower | Higher for the manager |
| Control | Typically lower | Typically higher |
| Access to financing | Quicker access to equity when needed | More reliant on existing investors |
| Investor access | No minimum investment size | Often requires large minimum investment |
The infrastructure sector has provided investors with strong returns over the past decade. For the 10 years to 31 December 2022, the listed infrastructure sector delivered 9.5% p.a. while unlisted infrastructure delivered 11.4% p.a.
Figure 3: Performance of listed versus unlisted infrastructure
Source: Bloomberg, EDHEC Infra, as at 31 December 2022. Notes: Global Listed Infrastructure is represented by the FTSE Global Core Infrastructure 50/50 100% Hedged to USD (Gross) Index. Unlisted Infrastructure is represented by the EDHEC infra300 Equity Index (Local).
It is important that investors are aware of the challenges that come with comparing the performance of listed versus unlisted infrastructure.
First, due to infrequent periodic performance assessments, unlisted index values tend to be backwards looking, failing to reflect current market sentiment and investment risk priced into equivalent assets in public markets. This means unlisted infrastructure index values tend to lag current market conditions and are inherently smoothed relative to listed benchmarks that are marked-to-market daily. The risk here is that when investors allocate new capital to unlisted, they could be receiving a stale valuation which, for example, may not reflect the current higher interest rate environment.
Second, it is important for investors to consider the underlying asset exposures found in listed versus unlisted indices. For example, below we compare two commonly used indices for listed and unlisted infrastructure. For unlisted infrastructure, we use the EDHEC infra300 index, which is a marked-to-market index calculated using estimated changes in the fair value of the assets using EDHEC’s internal valuation models.
Figure 4: Comparison of listed and unlisted Infrastructure benchmark asset exposures
| Unlisted Infrastructure EDHEC’s infra300 index | Global Listed Infrastructure FTSE Global Core Infrastructure 50/50 Index | |
| Constituents | 300 | 240 |
| Geographic exposure | EMEA – 70% Oceania – 15% Asia Pacific – 8% North America – 4% Latin America – 3% | EMEA – 10% Oceania – 8% Asia Pacific – 15% North America – 63% Latin America – 5% |
| Sector exposure | Transport – 21% Renewable Power – 21% Network Utilities – 17% Power Generation (ex-Renewables) – 10% Energy & Water Resources – 10% Social Infrastructure – 8% Environmental Services – 4% Data Infrastructure – 4% | Transport – 30% Renewable Power – 0% Network Utilities – 51% Power Generation (ex-Renewables) – 0% Energy & Water Resources – 10% Social Infrastructure – 0% Environmental Services – 0% Data Infrastructure – 8% |
Source: Bloomberg, EDHEC Infra, as at 31 December 2022.
Notes: Global Listed Infrastructure is represented by the FTSE Global Core Infrastructure 50/50 100% Hedged to USD (Gross) Index. Unlisted Infrastructure is represented by the EDHEC infra300 Equity Index (Local).
When compared to the listed infrastructure benchmark (the FTSE Global Core Infrastructure 50/50 Index), the geographic and sector exposures are vastly different. For instance, the unlisted infrastructure index has a much heavier geographical concentration to EMEA (70% for unlisted versus 10% for listed), whereas the listed infrastructure index is much more exposed to North America (4% for unlisted versus 63% for listed). Additionally, the unlisted index has comparatively high weightings to sub-sectors that many traditional GLI managers would not consider to be core ‘infrastructure’, including exposure to assets in merchant power generation. This highlights that many unlisted infrastructure funds may also have broader definitions of ‘infrastructure’, potentially due to the more limited number of opportunities available to them. The differences in geographic and sector exposures between the two markets also highlights that listed and unlisted infrastructure can be viewed as complementary with one another as investors consider their infrastructure allocations.
In considering performance over the past decade, we believe two key factors have contributed to the higher returns seen by unlisted infrastructure relative to listed. First, unlisted infrastructure assets tend to be financed using greater leverage. This has provided a tailwind for returns during a period when interest rates have generally declined and asset values have mostly risen. Second, we believe the valuation gap between the listed and direct markets has widened over the past 10 years. For unlisted infrastructure, this greater multiple expansion has driven an even stronger performance outcome when combined with the benefits of leverage. It is worth remembering that with higher leverage also comes higher risk to equity.
It should not surprise investors that direct infrastructure transactions have generally occurred at significant premiums. The unlisted infrastructure universe has seen robust fundraising over the past decade. The amount of uninvested backlog, or ‘dry powder’, has now reached over $300 billion (2022).** In line with these strong capital inflows, the demand for quality infrastructure assets has also grown. With a relatively limited number of available assets for sale, competitive tension has increased across private buyers in recent years. This has led to premium valuation multiples being paid for assets in the direct market relative to equivalent assets listed on public markets (see Figure 1).
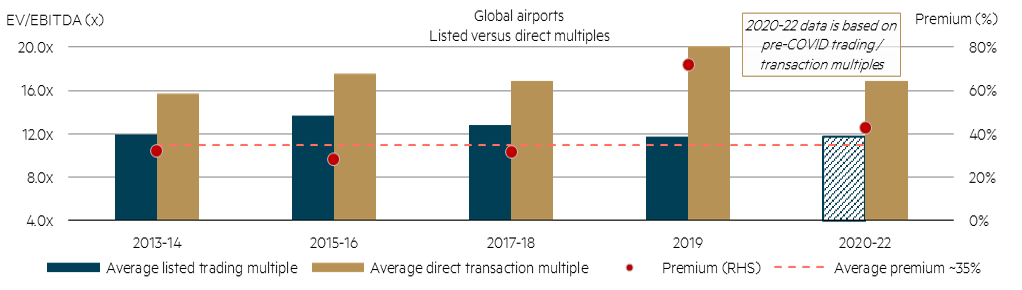
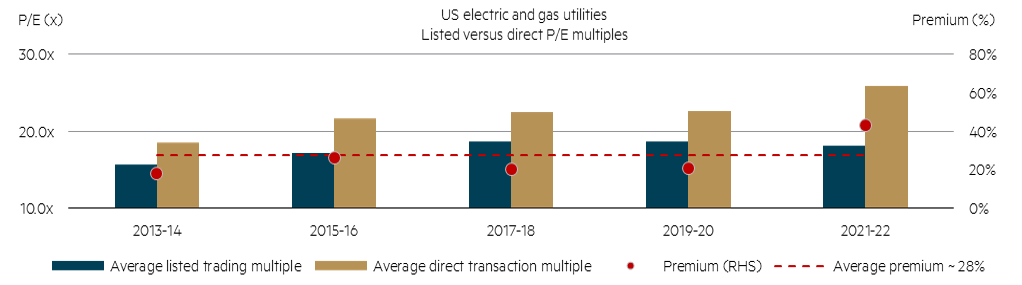
Our views on this are supported by a proprietary database of more than 240 infrastructure transactions over the past decade. It is possible that direct infrastructure multiples in any given year are driven more by the types of deals (that is, asset mix) rather than a true reflection of how direct market valuations across all sectors have changed. To address this, we also conducted analysis on two infrastructure sub-sectors that have seen meaningful deal activity over the past 10 years, and with which there is meaningful publicly available data: the global airport sector and the US electric and gas utility sector. We found the valuation gap in listed versus direct markets for these two sectors has also now widened to unprecedented levels relative to what we have experienced over most of the past decade.
In the case of global airports (Figure 5), we reviewed 35 transactions over 10 years. The average transaction multiple over this period was 17.0x EV/EBITDA, which represents a 35% premium to the average trading multiple of listed airport companies over the period of 12.6x.^ Notably, global airport transactions occurring over the past four years have, on average, been occurring at premiums greater than 35%, suggesting the valuation gap between listed and unlisted assets has widened to above-average levels.
There is a similar phenomenon in the case of US electric and gas utilities (Figure 6), where we reviewed 34 transactions over the same period. The average transaction multiple over the period was 22.6x P/E, which represents a 28% premium to the average trading multiple of 17.7x. Over the past two years, we have also seen US electric and gas utilities transact at multiples, on average, greater than 28%.
Figure 5: Valuation comparison in the global airports sector
Source: Bloomberg, Infralogic, Sentieo, MBA GLI internal research as at 31 December 2022. Notes: Analysis is based on 35 global airport transactions occurring between 2013 and 2022. Past performance is not a reliable indicator of future performance.
Figure 6: Valuation comparison in the US electric and gas utility sector
Source: Bloomberg, Infralogic, Sentieo, MBA GLI internal research as at 31 December 2022. Notes: Analysis is based on 34 US electric and gas utility transactions occurring between 2013 and 2022. Past performance is not a reliable indicator of future performance.
We believe it is important to consider the likely reasons for the historical outperformance of unlisted over listed infrastructure, and whether this has been driven by structural or temporal factors. In our view, the combined tailwinds of greater leverage, rising asset prices and a widening valuation gap between assets in the listed and direct markets have been the major contributors. Many of these tailwinds are unlikely to continue indefinitely and some appear to have been caused by short-lived factors, including a historical period of declining and low interest rates.
We believe investing in infrastructure can provide meaningful benefits to investors. Over the past decade, several structural (higher leverage) and transient factors (rising asset prices and a widening valuation gap) have benefited the performance of unlisted infrastructure relative to listed. It is unlikely these tailwinds will persist indefinitely. In fact, at some point they will probably reverse, providing a headwind to unlisted returns. We believe now is an opportune time for investors to consider listed infrastructure as a means of gaining exposure to this attractive asset class at a lower valuation.
* Refer to Figure 3. Global Listed Infrastructure is represented by the FTSE Global Core Infrastructure 50/50 100% Hedged to USD (Gross) Index. Unlisted Infrastructure is represented by the EDHEC infra300 Equity Index (Local).
** Global Listed Infrastructure Organisation (GLIO).
*** A recent example of this, which we discuss in our previous white paper, is in the case of the UK water utilities. In the latest regulatory period, the three listed UK water utilities – Severn Trent, United Utilities, and South West Water (owned by Pennon) – were the only ones to receive fast-track approval for their business plans between 2020-25. This allowed them to receive their price reviews before their unlisted peers.
^ Global airport trading and transaction multiples have been materially impacted post-COVID due to passenger air traffic recovering at different rates depending on differences in local lockdown laws, as well as demographic differences in appetite to resume air travel. As a result, the average listed EV/EBITDA trading multiple for global airports has been calculated using data between 2013 and 2019. Similarly, transaction multiples for transactions occurring post-COVID have been calculated using pre-COVID (e.g. 2019) EV/EBITDA multiples.
Disclaimer
This information was prepared and issued by Maple-Brown Abbott Ltd ABN 73 001 208 564, Australian Financial Service Licence No. 237296 (“MBA”). Maple-Brown Abbott is registered as an investment advisor with the United State Securities and Exchange Commission under the Investment Advisers Act of 1940. This information must not be reproduced or transmitted in any form without the prior written consent of MBA. This information does not constitute investment advice or an investment recommendation of any kind and should not be relied upon as such. This information is general information only to wholesale clients (as defined by the Corporations Act 2001 (Australia Cth) and the Financial Markets Conduct Act 2013 (NZ)) and it does not have regard to any person’s investment objectives, financial situation or needs. Before making any investment decision, you should seek independent investment, legal, tax, accounting or other professional advice as appropriate. Past performance is not a reliable indicator of future performance. Any comments about investments are not a recommendation to buy, sell or hold. Any views expressed on individual stocks or other investments, or any forecasts or estimates, are point in time views and may be based on certain assumptions and qualifications not set out in part or in full in this information. The views and opinions contained herein are those of the authors as at the date of publication and are subject to change due to market and other conditions. Such views and opinions may not necessarily represent those expressed or reflected in other MBA communications, strategies or funds. Information derived from sources is believed to be accurate, however such information has not been independently verified and may be subject to assumptions and qualifications compiled by the relevant source and this information does not purport to provide a complete description of all or any such assumptions and qualifications. To the extent permitted by law, neither MBA, nor any of its related parties, directors or employees, make any representation or warranty as to the accuracy, completeness, reasonableness or reliability of the information contained herein, or accept liability or responsibility for any losses, whether direct, indirect or consequential, relating to, or arising from, the use or reliance on any part of this information. Douse Associates (registered in England under No. 10837002 and authorised and regulated by the Financial Conduct Authority) is authorised to distribute this marketing communication to certain UK investors. Hyde Park Investment International Limited (incorporated in Malta, company reference number C 44733) is authorised to distribute this marketing communication to certain UK and EU investors.
Interested in investing with us?
We use a tight definition of infrastructure assets with low-volatility cashflows and inflation protection to achieve diversification benefits with other asset classes, such as global equities.